Feature Coming Soon!
The newsletter functionality is under development.
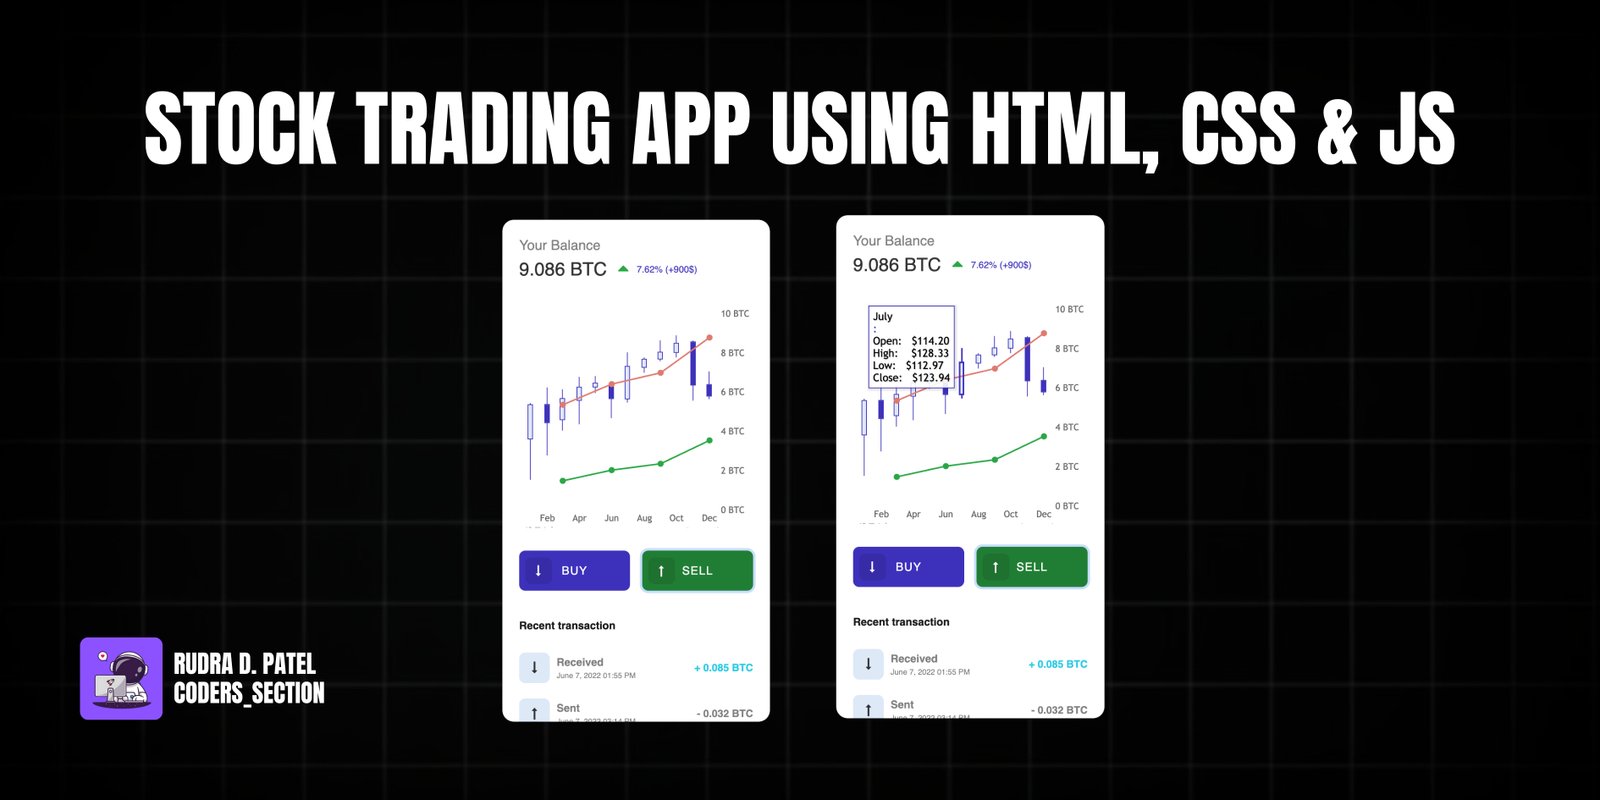
This project showcases a sleek and functional Stock Trading App UI, built using HTML, CSS, and JavaScript. It provides a clean and intuitive interface for users to monitor their balance, view interactive stock charts, and simulate buy/sell transactions. The app focuses on delivering a visually appealing and responsive design, making it suitable for both desktop and mobile viewing.
Key features include a dynamic balance display with percentage changes, an integrated candlestick chart for visualizing stock trends (powered by CanvasJS), and prominent buy/sell action buttons. Additionally, a "Recent Transactions" section provides a clear overview of simulated trade history, complete with transaction types, dates, and amounts. The design emphasizes clarity and ease of use, providing a realistic trading application experience.
The HTML structure for the Stock Trading App is organized into distinct sections: a header displaying the user's balance, a main body section for the interactive chart, a section for buy/sell action buttons, and a final section for recent transactions. The layout utilizes Bootstrap grid classes for responsiveness. The chart container is a `div` element where the CanvasJS chart will be rendered. Transaction details are structured using nested `div` elements to represent individual entries, including icons, titles, captions, and amounts. This modular HTML design ensures a clear separation of concerns and facilitates easy styling and scripting.
<!DOCTYPE html>
<html>
    <head>
        <meta charset="utf-8">
        <meta name="viewport" content="initial-scale=1, maximum-scale=1, user-scalable=no, width=device-width">
        <title>Trading App - UI Design | Coders_Section</title>
        <link href="css/bootstrap.min.css" rel="stylesheet" type="text/css"/>
        <link href="css/font-awesome.min.css" rel="stylesheet" type="text/css"/>
        <link href="css/custom.css" rel="stylesheet" type="text/css"/>
    </head>
    <body>

        <div id="ta_app" class="container-fluid">

            <!-- Start Section Header 1 -->
            <section id="ta_header" class="row">

                <div class="col-12">
                    <div class="name">
                        Your Balance
                    </div>
                </div>
                <div class="col-12">
                    <div class="caption">
                        9.086 BTC
                        <i class="fa fa-caret-up text-success mr-1 ml-2"></i>
                        <span>
                            7.62% (+900$)
                        </span>
                    </div>
                </div>

            </section>
            <!-- End Section Header 1 -->

            <!-- Start Section Body -->
            <section id="ta_body_chart" class="row">

                <div id="chartContainer" style="height: 300px; " class="col-12 pl-0 text-center">

                </div>

            </section>
            <!-- End Section Body -->

            <!-- Start Section Body -->
            <section id="ta_action_btns" class="row">

                <div class="col-6 text-center pr-2">
                    <button class="btn ta_btn_buy w-100">
                        <i class="fa fa-long-arrow-down"></i> BUY
                    </button>
                </div>
                <div class="col-6 text-center pl-2">
                    <button class="btn ta_btn_sell bg-success w-100">
                        <i class="fa fa-long-arrow-up"></i> SELL
                    </button>
                </div>

            </section>
            <!-- End Section Body -->

            <!-- Start Section Body -->
            <section id="ta_body_transactions" class="row">

                <div class="col-12 text-center">
                    <div class="body_title text-left">
                        Recent transaction
                    </div>
                    <div class="transactions_list">
                        <div class="row">
                            <div class="col-2 justify-content-center align-self-center transactions_thumb">
                                <i class="fa fa-long-arrow-down"></i>
                            &>
                            <div class="col-6 text-left pl-2 justify-content-center align-self-center">
                                <span class="transaction_title">
                                    Received
                                </span>
                                <span class="transaction_caption">
                                    June 7, 2022 01:55 PM
                                </span>
                            </div>
                            <div class="col-4 justify-content-center align-self-center text-right transaction_amount">
                                + 0.085 BTC
                            </div>
                        </div>
                        <div class="row">
                            <div class="col-2 justify-content-center align-self-center transactions_thumb">
                                <i class="fa fa-long-arrow-up"></i>
                            </div>
                            <div class="col-6 text-left pl-2 justify-content-center align-self-center">
                                <span class="transaction_title">
                                    Sent
                                </span>
                                <span class="transaction_caption">
                                    June 7, 2022 03:14 PM
                                </span>
                            </div>
                            <div class="col-4 justify-content-center align-self-center text-right transaction_amount amount_sent">
                                - 0.032 BTC
                            </div>
                        </div>
                        <div class="row">
                            <div class="col-2 justify-content-center align-self-center transactions_thumb">
                                <i class="fa fa-long-arrow-down"></i>
                            </div>
                            <div class="col-6 text-left pl-2 justify-content-center align-self-center">
                                <span class="transaction_title">
                                    Received
                                </span>
                                <span class="transaction_caption">
                                    June 7, 2022 05:38 PM
                                </span>
                            </div>
                            <div class="col-4 justify-content-center align-self-center text-right transaction_amount">
                                + 1.065 BTC
                            </div>
                        </div>
                    </div>
                </div>

            </section>
            <!-- End Section Body -->


        </div>


        <script src="js/jquery.min.js" type="text/javascript"></script>
        <script src="js/canvasjs.min.js" type="text/javascript"></script>
        <script src="js/data-chart.js" type="text/javascript"></script>
        <script src="js/custom.js" type="text/javascript"></script>
    </body>
</html>
The CSS styling for the Stock Trading App focuses on creating a modern, clean, and responsive user interface. It defines the overall layout of the app container, including its positioning, dimensions, and shadows. Specific styles are applied to the header for balance display, ensuring clear typography and visual hierarchy. The chart area is styled to integrate seamlessly, and the buy/sell buttons are designed with distinct colors and icons for immediate recognition. The "Recent Transactions" section uses CSS to format individual transaction entries, providing clear visual cues for received and sent amounts. Media queries are included to ensure the app's layout adapts gracefully to different screen sizes, maintaining usability across devices.
*
{
  margin: 0;
  padding: 0;
  outline: none;
}

body
{
  font-family: 'Poppins', sans-serif;
  overflow: hidden;
  background: #313131;/*#2196f3;*/
}

:root{
  --app-bg-color: #fff;
  --app-primary-color: #3d30bb; /* ea0100 */
  --app-text-dark-color: rgba(0, 0, 0, 0.8);
  --app-text-light-color: rgba(0, 0, 0, 0.5);
}

#ta_app
{
  position: absolute;
  right: 40%;
  width: 350px;
  height: 90%;
  padding: 0 22px;
  padding-bottom: 20px;
  overflow: hidden;
  background-color: var(--app-bg-color);
  margin-top: 30px;
  border-radius: 15px;
  box-shadow: 0 0 0 0.5px rgba(255,255,255,0.3),
              60px 70px 40px -55px rgba(0,0,0,0.5);
}
@media only screen and (max-width: 600px) {
  #ta_app {
    position: absolute;
  right: 20%;
  width: 350px;
  height: 90%;
  padding: 0 22px;
  padding-bottom: 20px;
  overflow: hidden;
  background-color: var(--app-bg-color);
  margin-top: 30px;
  border-radius: 15px;
  box-shadow: 0 0 0 0.5px rgba(255,255,255,0.3),
              60px 70px 40px -55px rgba(0,0,0,0.5);
  }
}
@media only screen and (max-width: 550px) {
  #ta_app {
    right: 12%;
  }}
  @media only screen and (max-width: 400px) {
    #ta_app { position: absolute;
      right: 7%;
      width: 330px;
      height: 90%;
      padding: 0 22px;}}
      @media only screen and (max-width: 375px) {
        #ta_app { position: absolute;
          right: 4%;
          width: 295px;
          height: 90%;
          padding: 0 22px;}}


/** **/
#ta_header
{
  margin-top: 20px;
}

#ta_header div.name
{
  font-size: 18px;
  font-weight: 500;
  color: var(--app-text-light-color);
}

#ta_header div.caption
{
  font-size: 24px;
  font-weight: 500;
  margin-top: 0px;
  color: var(--app-text-dark-color);
}

#ta_header div.caption i
{
  position: relative;
  top: -2px;
}

#ta_header div.caption span
{
  position: relative;
  font-size: 12px;
  font-weight: 500;
  color: var(--app-primary-color);
  top: -4px;
}


/** **/
#ta_body_chart
{
  position: relative;
  margin-top: 30px;
}

#ta_body_chart > div
{
  position: relative;
  margin-left: -15px;
}

#ta_body_chart > div:after
{
  position: absolute;
  content: ' ';
  width: 100%;
  height: 20px;
  background-color: #fff;
  left: 0;
  bottom: 0;
  margin-bottom: -10px;
}


/** **/
#ta_action_btns
{
  margin-top: 20px;
}

#ta_action_btns .btn
{
  position: relative;
  font-size: 15px;
  font-weight: 500;
  letter-spacing: 1px;
  border-radius: 8px;
  border: none;
  padding-top: 15px;
  padding-bottom: 15px;
  color: #fff;
}

#ta_action_btns i.fa
{
  position: absolute;
  width: 35px;
  height: 35px;
  line-height: 35px;
  background-color: rgba(0,0,0,0.1);
  border-radius: 8px;
  left: 0;
  top: 50%;
  transform: translateY(-50%);
  margin-left: 8px;
}

#ta_action_btns .ta_btn_buy
{
  background-color: var(--app-primary-color);
}


/** **/

#ta_body_transactions
{
  margin-top: 20px;
  padding: 15px 0;
}

#ta_body_transactions .body_title
{
  font-size: 14px;
  font-weight: 600;
  color: rgba(0, 0, 0, 0.9);
}

#ta_body_transactions .body_title span
{
  font-size: 10px;
  font-weight: 600;
  color: var(--app-primary-color);
  float: right;
  margin-top: 2px;
  background-color: #fff;
  padding: 2px 10px;
  border-radius: 50px;
}

#ta_body_transactions li
{
  list-style: none;
}

div.transactions_list
{
  margin-top: 25px;
}

div.transactions_list > div
{
  margin-top: 20px;
}

div.transactions_list .transactions_thumb i
{
  width: 40px;
  height: 40px;
  line-height: 40px;
  font-size: 16px;
  border-radius: 8px;
  background-color: #dee9f8;
  color: var(--app-text-dark-color);
}

div.transactions_list .transaction_title
{
  font-size: 14px;
  font-weight: 600;
  display: block;
  color: var(--app-text-light-color);
}

div.transactions_list .transaction_caption
{
  font-size: 10px;
  font-weight: 500;
  display: block;
  color: var(--app-text-light-color);
}

div.transactions_list .transaction_amount
{
  font-size: 13.5px;
  font-weight: 600;
  display: block;
  color: #29cbe4;
}

div.transactions_list .amount_sent
{
  color: var(--app-text-light-color);
}
The `data-chart.js` file is responsible for rendering the interactive candlestick and line charts using the CanvasJS library. It initializes a new CanvasJS Chart object, specifying various properties such as animation, theme, and axis configurations. The `data` array within the chart object holds the actual stock data points, including open, high, low, and close values for the candlestick series, and additional data for the line series. This script also includes a `toggleDataSeries` function, allowing users to interactively show or hide data series on the chart, providing a dynamic visualization of stock performance.
var chart = new CanvasJS.Chart("chartContainer", {
        animationEnabled: true,
        theme: "light2", // "light1", "light2", "dark1", "dark2"
        exportEnabled: false,
        title:{
            text: ""
        },
        subtitles: [{
            text: ""
        }],
        axisX: {
            valueFormatString: "MMM",
            lineThickness: 0,
            gridThickness: 0,
            tickLength: 0
        },
        axisY: {
            prefix: "$",
            title: "",
            labelFontColor: "transparent",
            lineThickness: 0,
            gridThickness: 0,
            tickLength: 0
        },
        axisY2: {
            prefix: "",
            suffix: " BTC",
            title: "",
            tickLength: 0,
            lineThickness: 0,
            gridThickness: 0,
            tickLength: 0
        },
        toolTip: {
            shared: true
        },
        legend: {
            reversed: true,
            cursor: "pointer",
            itemclick: toggleDataSeries,
        },
        data: [{
            type: "candlestick",
            color: "#3d30bb",
            risingColor: "#dee9f8",
            showInLegend: true,
            cornerRadius: 15,
            name: "",
            yValueFormatString: "$#,##0.00",
            xValueFormatString: "MMMM",
            dataPoints: [   // Y: [Open, High ,Low, Close]
                { x: new Date(2016, 0), y: [101.949997, 112.839996, 89.370003, 112.209999] },
                { x: new Date(2016, 1), y: [112.269997, 117.589996, 96.820000, 106.919998] },
                { x: new Date(2016, 2), y: [107.830002, 116.989998, 104.400002, 114.099998] },
                { x: new Date(2016, 3), y: [113.750000, 120.790001, 106.309998, 117.580002] },
                { x: new Date(2016, 4), y: [117.830002, 121.080002, 115.879997, 118.809998] },
                { x: new Date(2016, 5), y: [118.500000, 119.440002, 108.230003, 114.279999] },
                { x: new Date(2016, 6), y: [114.199997, 128.330002, 112.970001, 123.940002] },
                { x: new Date(2016, 7), y: [123.849998, 126.730003, 122.070000, 126.120003] },
                { x: new Date(2016, 8), y: [126.379997, 131.979996, 125.599998, 128.270004] },
                { x: new Date(2016, 9), y: [128.380005, 133.500000, 126.750000, 130.990005] },
                { x: new Date(2016, 10), y: [131.410004, 131.940002, 113.550003, 118.419998] },
                { x: new Date(2016, 11), y: [118.379997, 122.500000, 114.000000, 115.050003] }
            ]
        },
        {
            type: "line",
            color: "#28a745",
            showInLegend: true,
            name: "",
            axisYType: "secondary",
            yValueFormatString: "$#,##0.00bn",
            xValueFormatString: "MMMM",
            dataPoints: [
                { x: new Date(2016, 2), y: 1.510 },
                { x: new Date(2016, 5), y: 2.055 },
                { x: new Date(2016, 8), y: 2.379 },
                { x: new Date(2016, 11), y: 3.568 }
            ]
        },
        {
            type: "line",
            showInLegend: true,
            name: "",
            axisYType: "secondary",
            yValueFormatString: "$#,##0.00bn",
            xValueFormatString: "MMMM",
            dataPoints: [
                { x: new Date(2016, 2), y: 5.382 },
                { x: new Date(2016, 5), y: 6.436 },
                { x: new Date(2016, 8), y: 7.011 },
                { x: new Date(2016, 11), y: 8.809 }
            ]
        }]
    });
chart.render();

function toggleDataSeries(e) {
    if (typeof (e.dataSeries.visible) === "undefined" || e.dataSeries.visible) {
        e.dataSeries.visible = false;
    } else {
        e.dataSeries.visible = true;
    }
    e.chart.render();
}
The `custom.js` file for the Stock Trading App contains a simple JavaScript snippet that demonstrates how to implement a periodic page refresh. Currently, it uses `setInterval` to reload the page every 2 seconds, though this functionality is commented out. This file serves as a placeholder for any custom JavaScript logic specific to the trading app's interactions, such as handling button clicks for buy/sell actions, updating transaction lists, or fetching real-time data if integrated with an API. Developers can expand this file to add more dynamic features and interactivity to the application.
$(function(){

    setInterval(function() {
        //location.reload();
    }, 2000);

});
Watch a live demonstration of the Stock Trading App below.
This Stock Trading App UI project provides a robust foundation for building interactive financial applications. Its responsive design, coupled with dynamic charting capabilities and clear transaction displays, offers a compelling user experience. The modular HTML, CSS, and JavaScript structure ensures ease of customization and scalability for future enhancements.
You can easily customize this component by:
For a production-ready application, ensure robust error handling for API calls, implement secure user data management, and consider server-side logic for actual trading functionalities. Performance optimization for real-time data updates will also be crucial for a smooth user experience.
Click the button below to download the full source code. Download will be ready in 10 seconds.
Receive coding tips and resources updates. No spam.
We respect your privacy. Unsubscribe at any time.